Study · September 2026
Does a 90% guarantee hold for the patients who are ill?
A conformal classifier returns a set of possible diagnoses instead of one label, with a guarantee on how often that set contains the right answer. The guarantee is an average over everyone. I measured what it delivers to the patients who are having a heart attack, and what becomes of it at two hospitals it was not calibrated on.
3 public datasets · 45,923 tracings · 200 calibration draws
State: published, v1.0.0 · Every figure is drawn from a committed results file
In plain terms
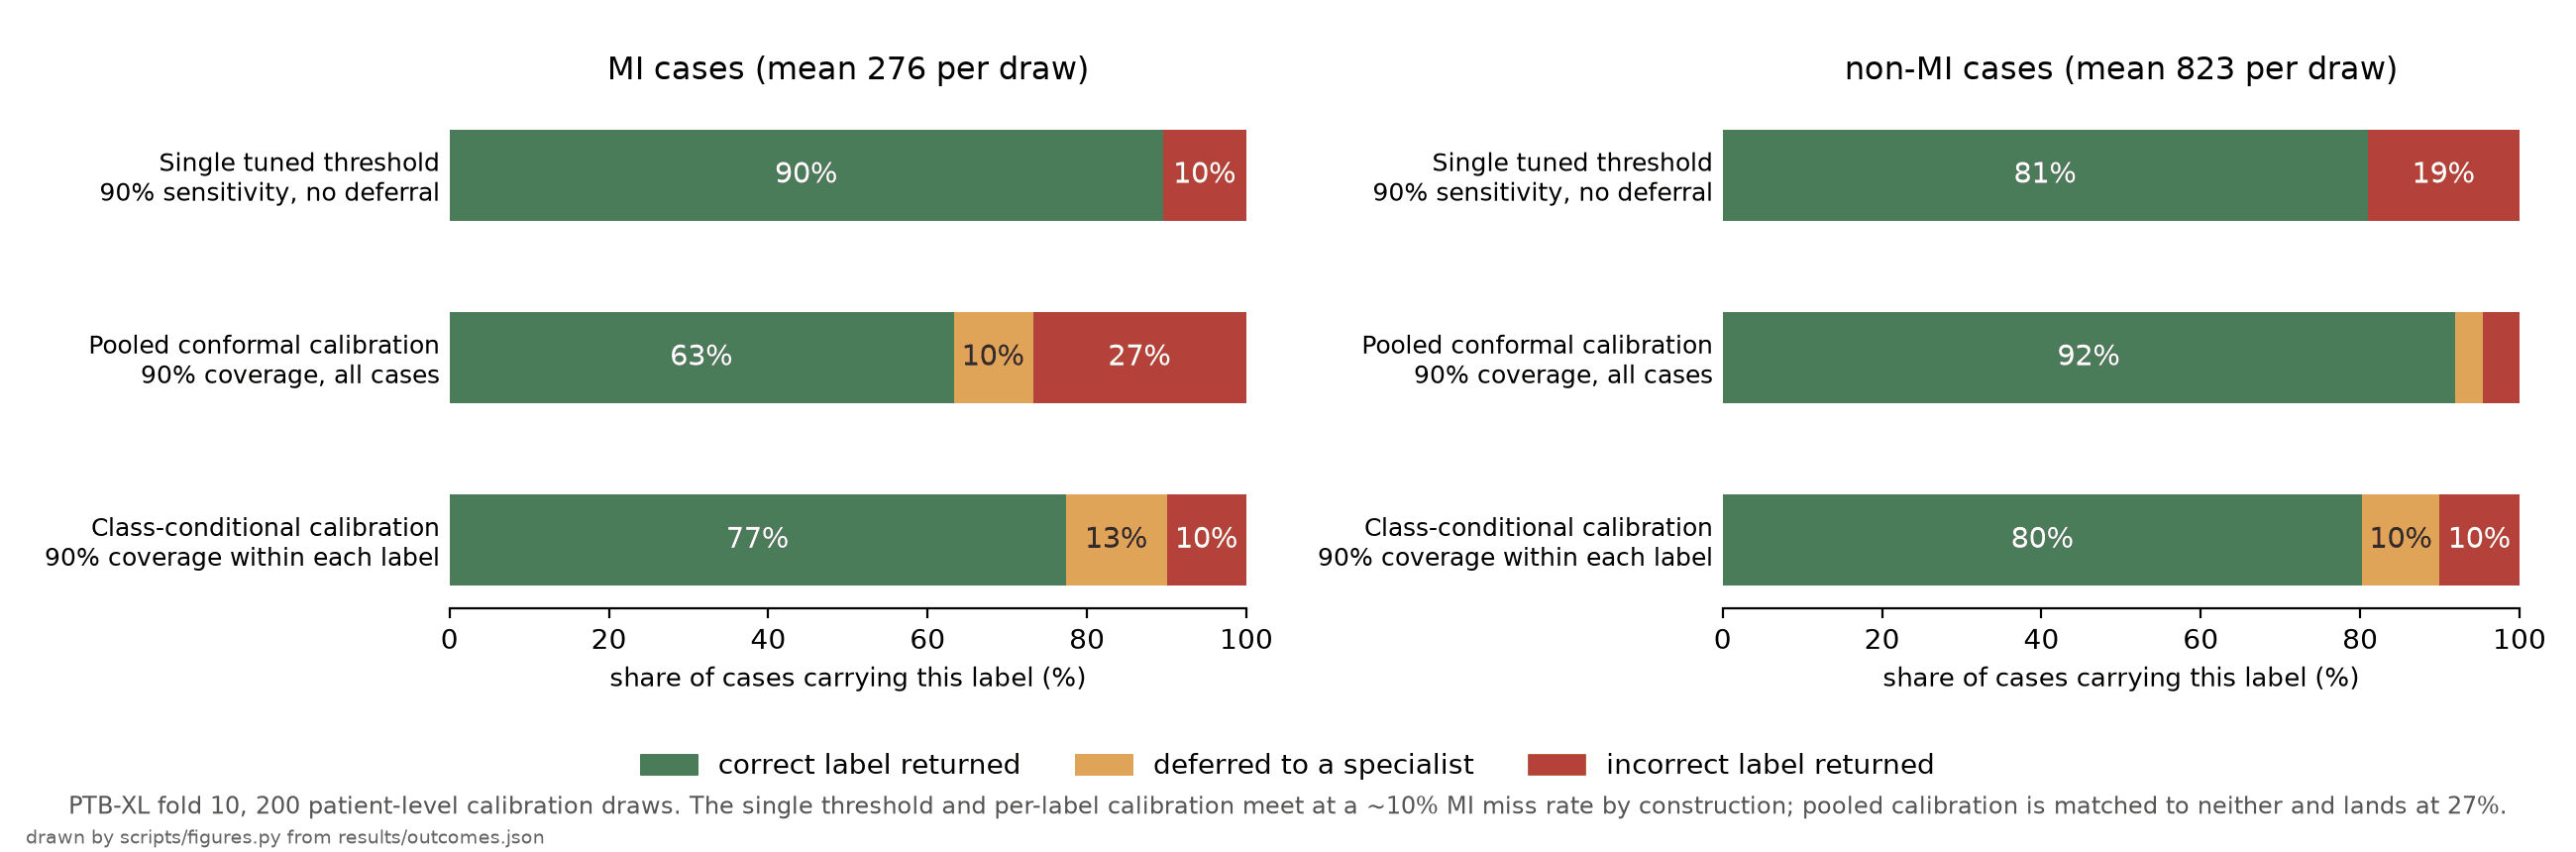
An algorithm that reads electrocardiograms usually returns one answer. A conformal one returns the set of answers it cannot rule out, calibrated so that the set contains the right diagnosis in 90 cases out of 100, which is the whole of what the method guarantees. The set most often holds one label, and that settles the case. Where it holds two labels, or none at all, a specialist reads the tracing instead.
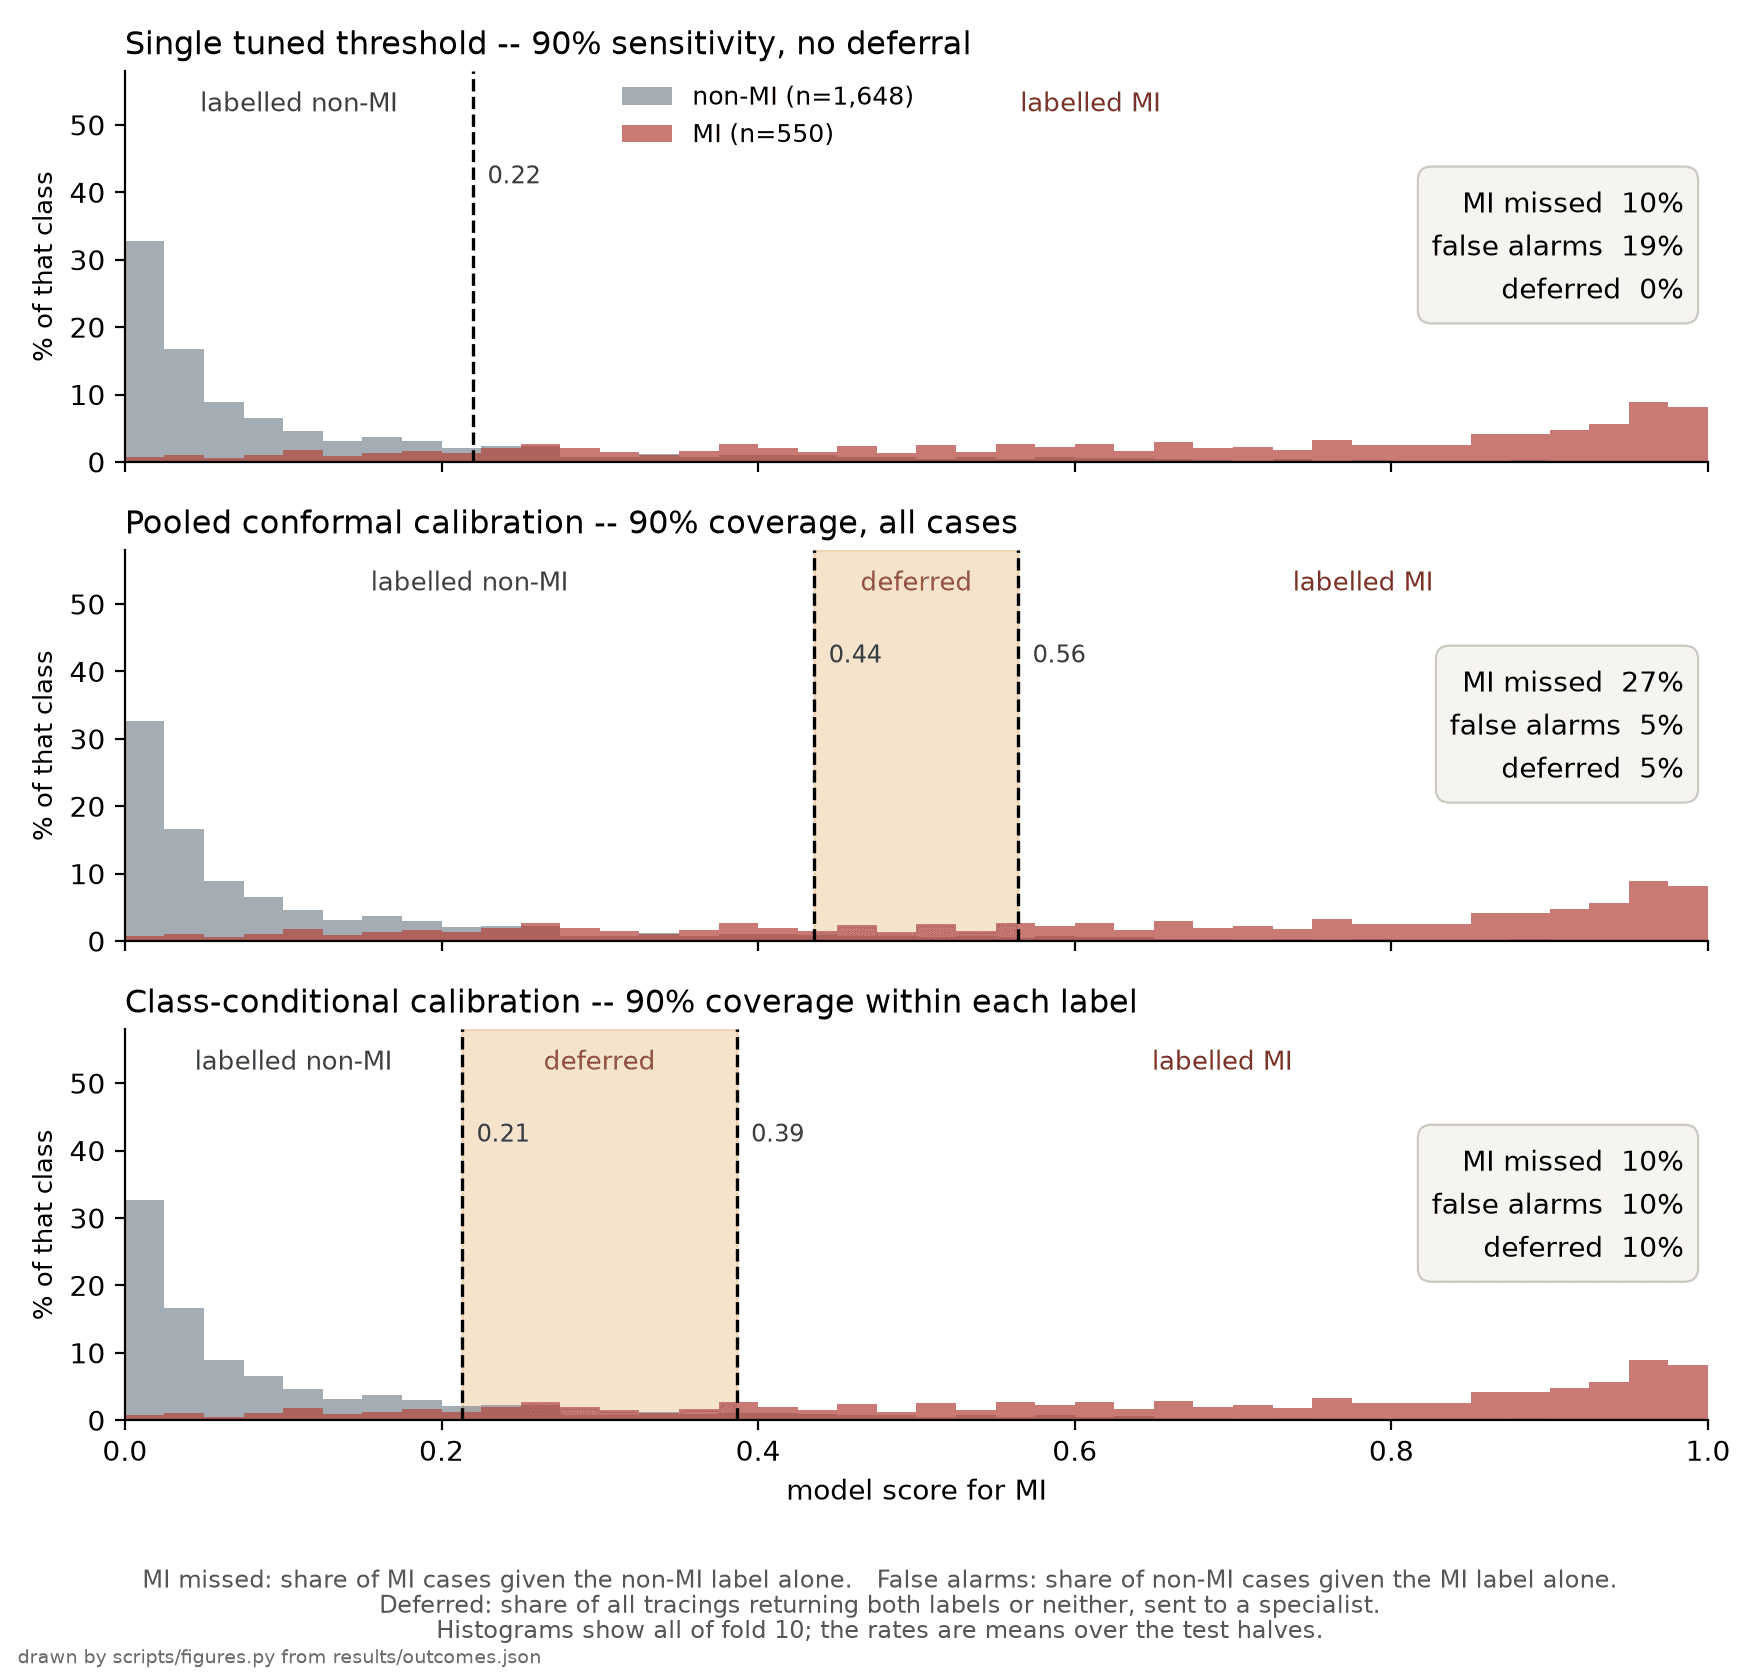
Three quarters of this population are not having a heart attack, and covering them well is enough to reach the 90%. Inside the infarction cases alone, on held-out patients at that same site, the same calibration covers only 73.2% of them — so more than one in four patients with infarction gets a set with no infarction in it. That threshold then goes, unchanged, to a hospital in Shandong and to an angiography cohort in Chongqing.
At the site the threshold was fitted on, PTB-XL in Germany, over 2,198 tracings:
Fitting a threshold within each label brings coverage to 90.0% at this site.
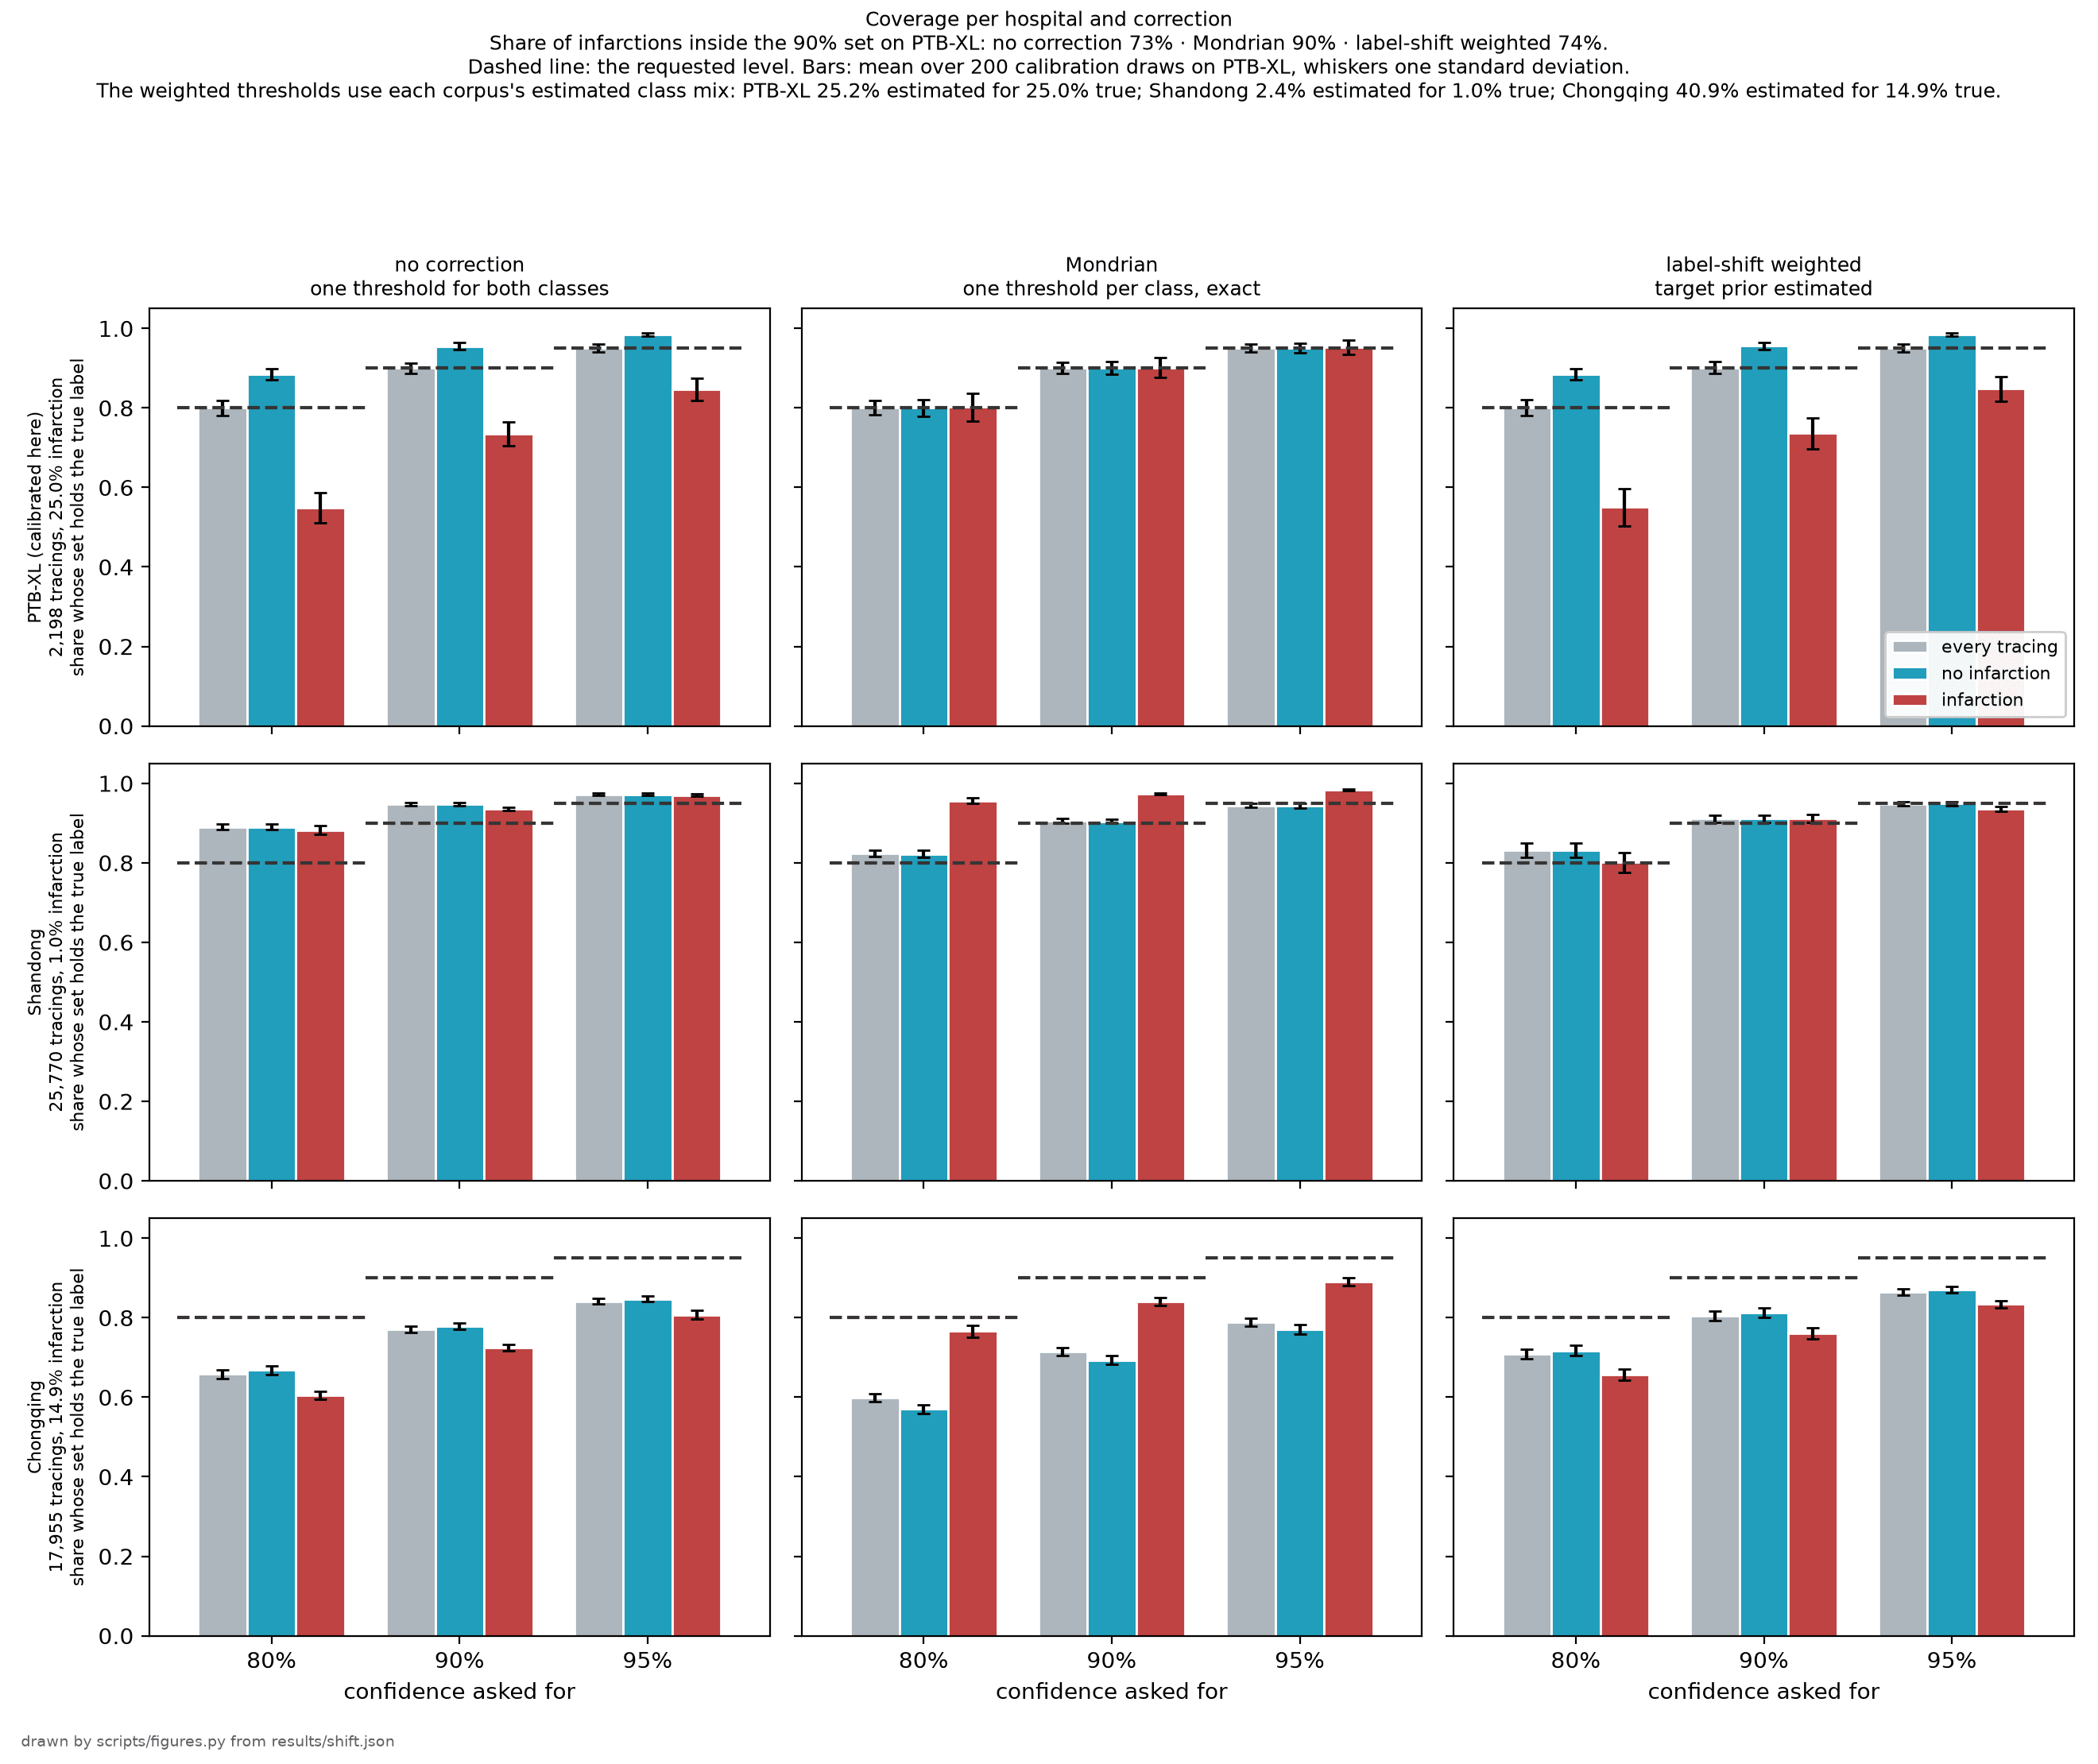
The same threshold, carried unchanged to two Chinese hospitals:
At Chongqing the same class-conditional correction reaches only 84.0%, short of the 90% asked for.
What was measured
The classifier reaches an AUROC of 0.932 on the infarction label against a published anchor of 0.930. The two are different quantities — the anchor averages five diagnostic classes rather than reporting infarction alone — so their agreement is a plausibility check on an ordinary baseline and not a reproduction. The model was frozen after that, so the coverage differences come only from where the threshold is placed.
Limits
The study covers one source dataset, one diagnosis and two target sites — and the two moved in opposite directions, so the direction and the size of the effect at a third site stay unknown. At Chongqing the positive label comes from a discharge diagnosis of acute infarction rather than from the tracing, and the hardware, the population and the recording years all differ at once, so the study measures the resulting gap without being able to attribute it.
Coverage is an average over the cases of a label and says nothing about one tracing. A clinician reading a positive result wants the chance that a case flagged as infarction really is one, which is a different quantity. The work was never tested in clinical use, and this is not a medical device.
Where to check the numbers
The repository holds the report and its references, and tests that fail when a published number no longer matches its source.